Go back
Swll - Transforming complex forecast data into a 5-second decision tool for surfers
Design
Quentin Guérandel
Dev
In progress
Impact
The project is currently in development (SwiftUI for iOS, Jetpack Compose for Android).
Metric | Result |
|---|---|
Projected NPS | 70+ (focus group prototype testing) |
Time-to-decision | Under 30 seconds vs. 2 minutes competitor benchmark |

Overview
Led the 0 to 1 design of Swll, a surf forecast mobile app built around a single question: "Should I go?" By shifting from data display to decision synthesis, the prototype reduced time-to-decision from 2 minutes (competitor benchmark) to under 30 seconds, with a projected NPS of 70+ in focus group testing.
Challenge
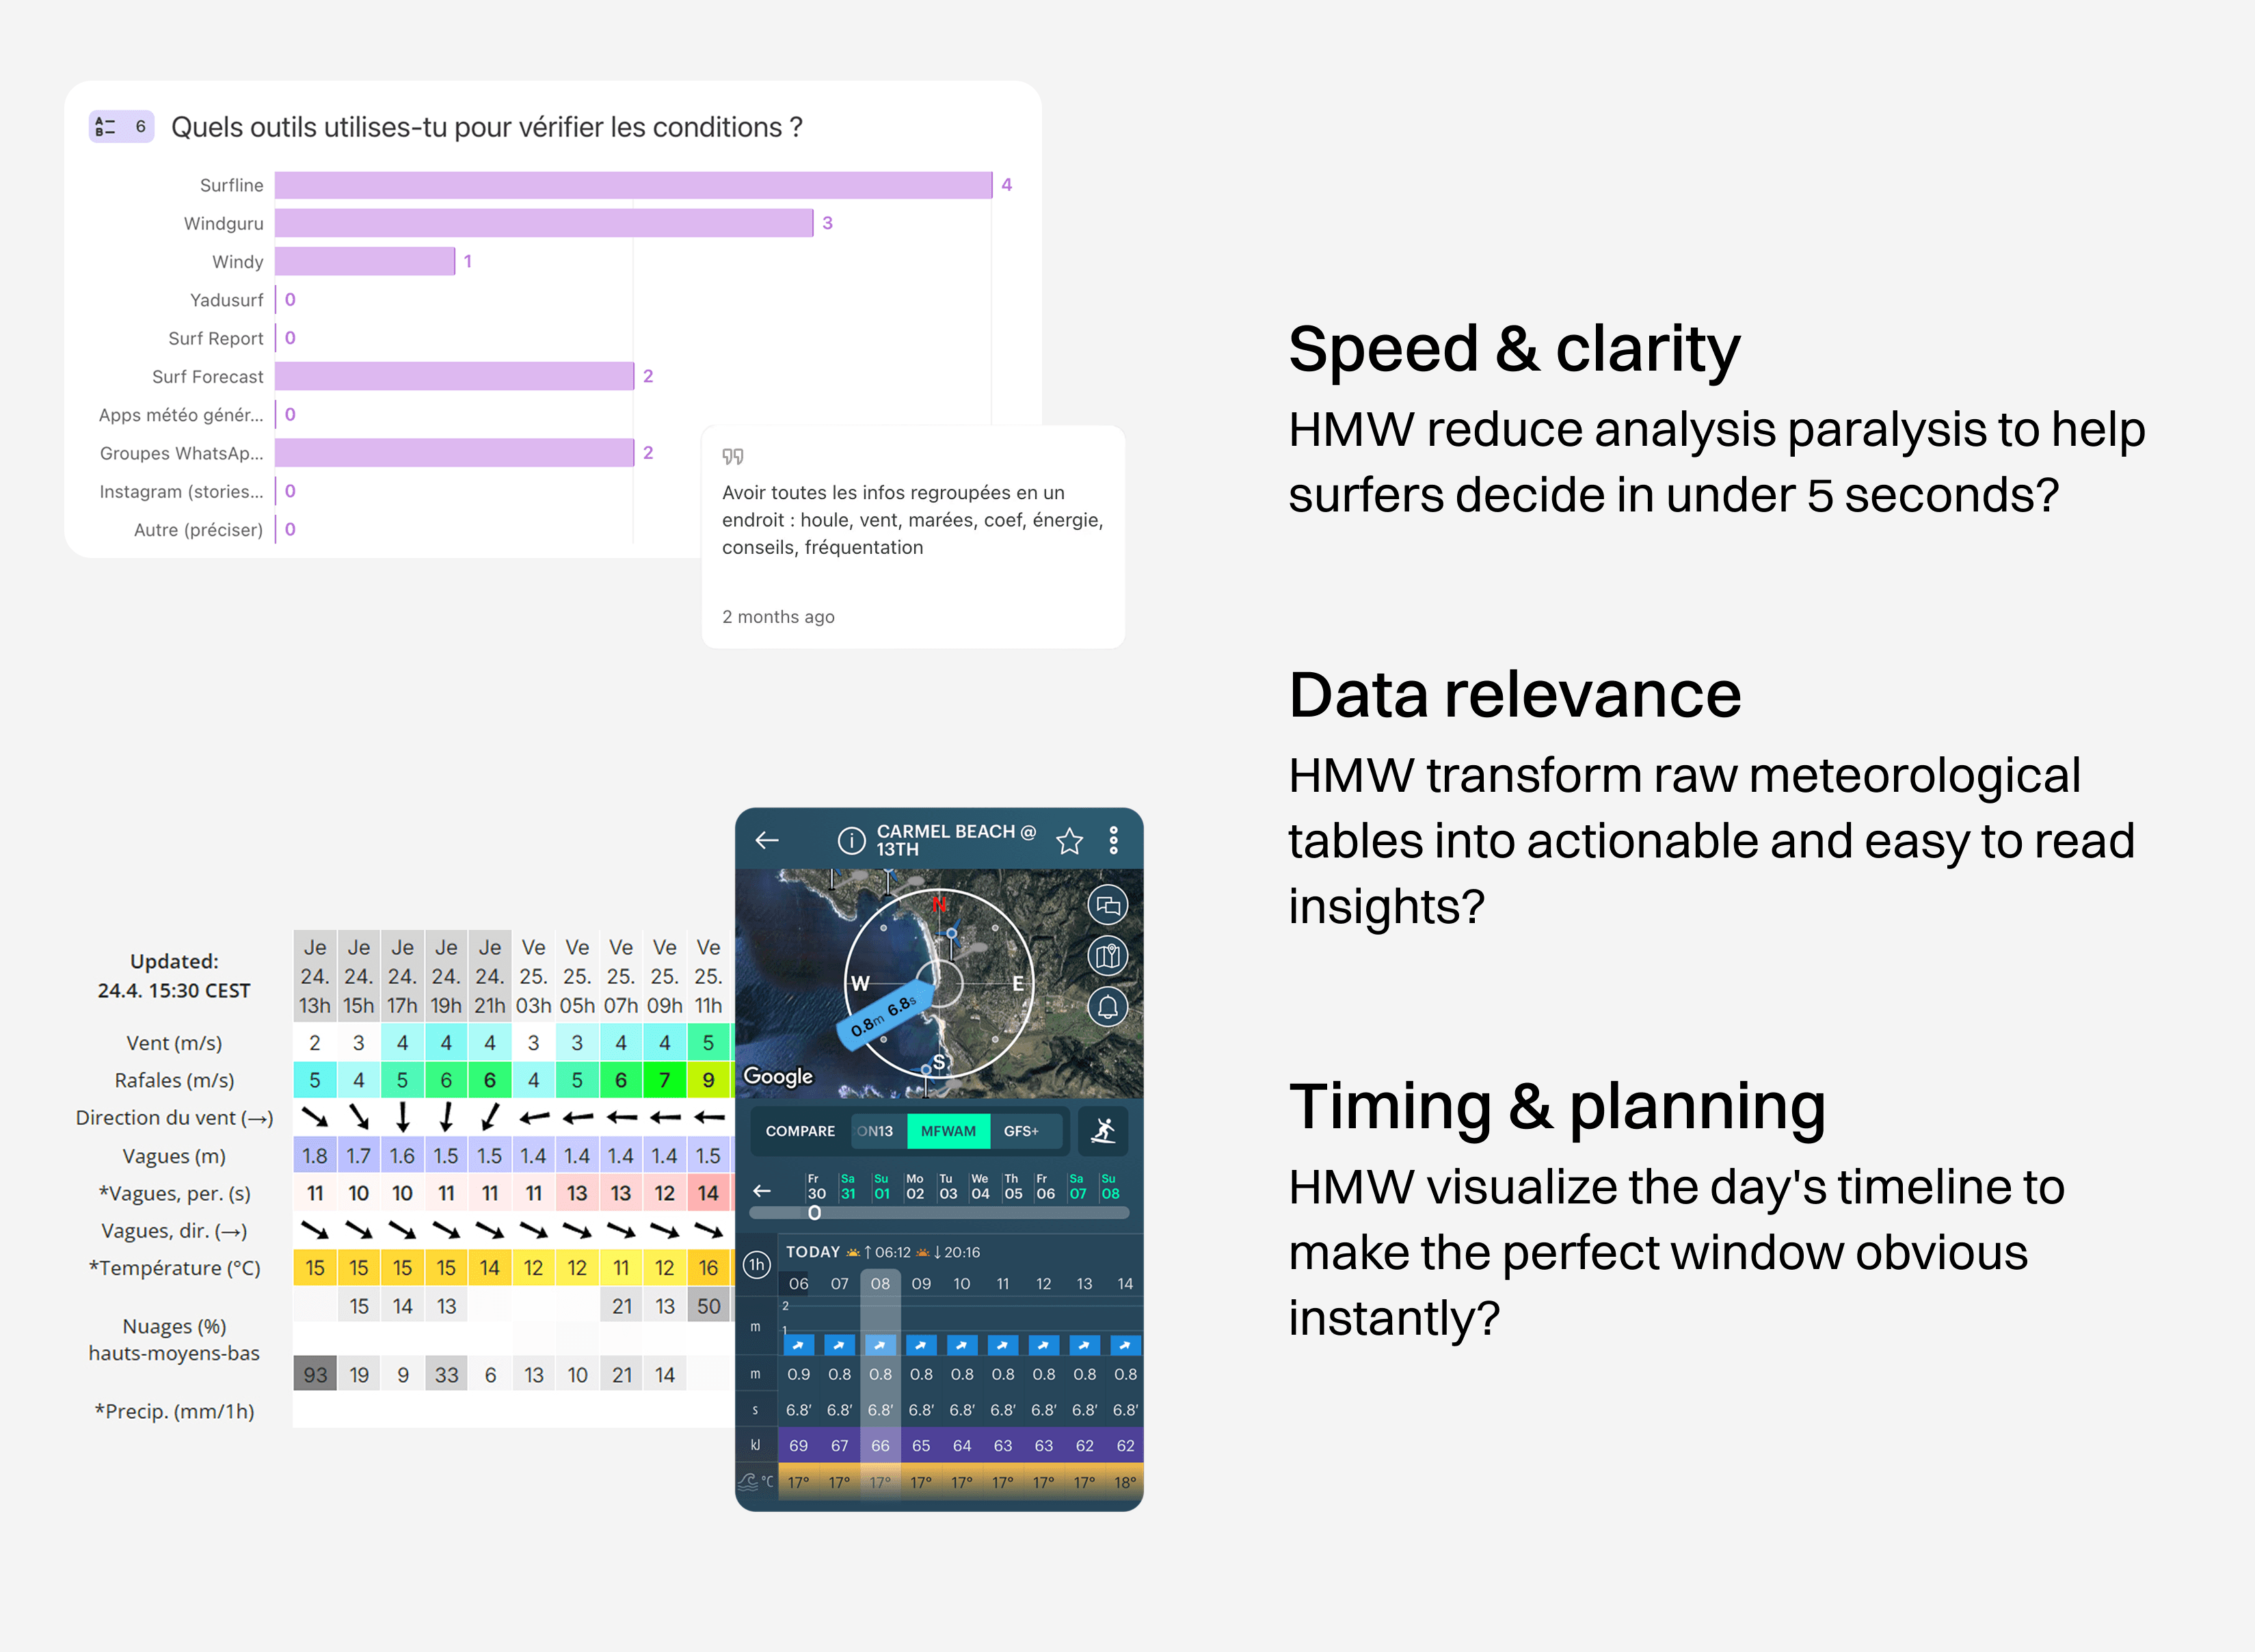
Surfers juggle 3 to 5 apps to make a single session decision, cross-referencing wind, swell, tide, and webcam data across fragmented interfaces. Existing tools display raw meteorological tables that require significant mental effort to decode. The result is analysis paralysis, not action.
Three core problems emerged from user interviews and Typeform surveys:
Data toxicity: dense, Excel-like tables that punish casual users and experts alike. The 5-second gap: no existing tool could answer "Should I go?" at a glance. Lack of personalization: generic alerts with no awareness of the user's level and preferred spots.
Solution
Key design decisions:
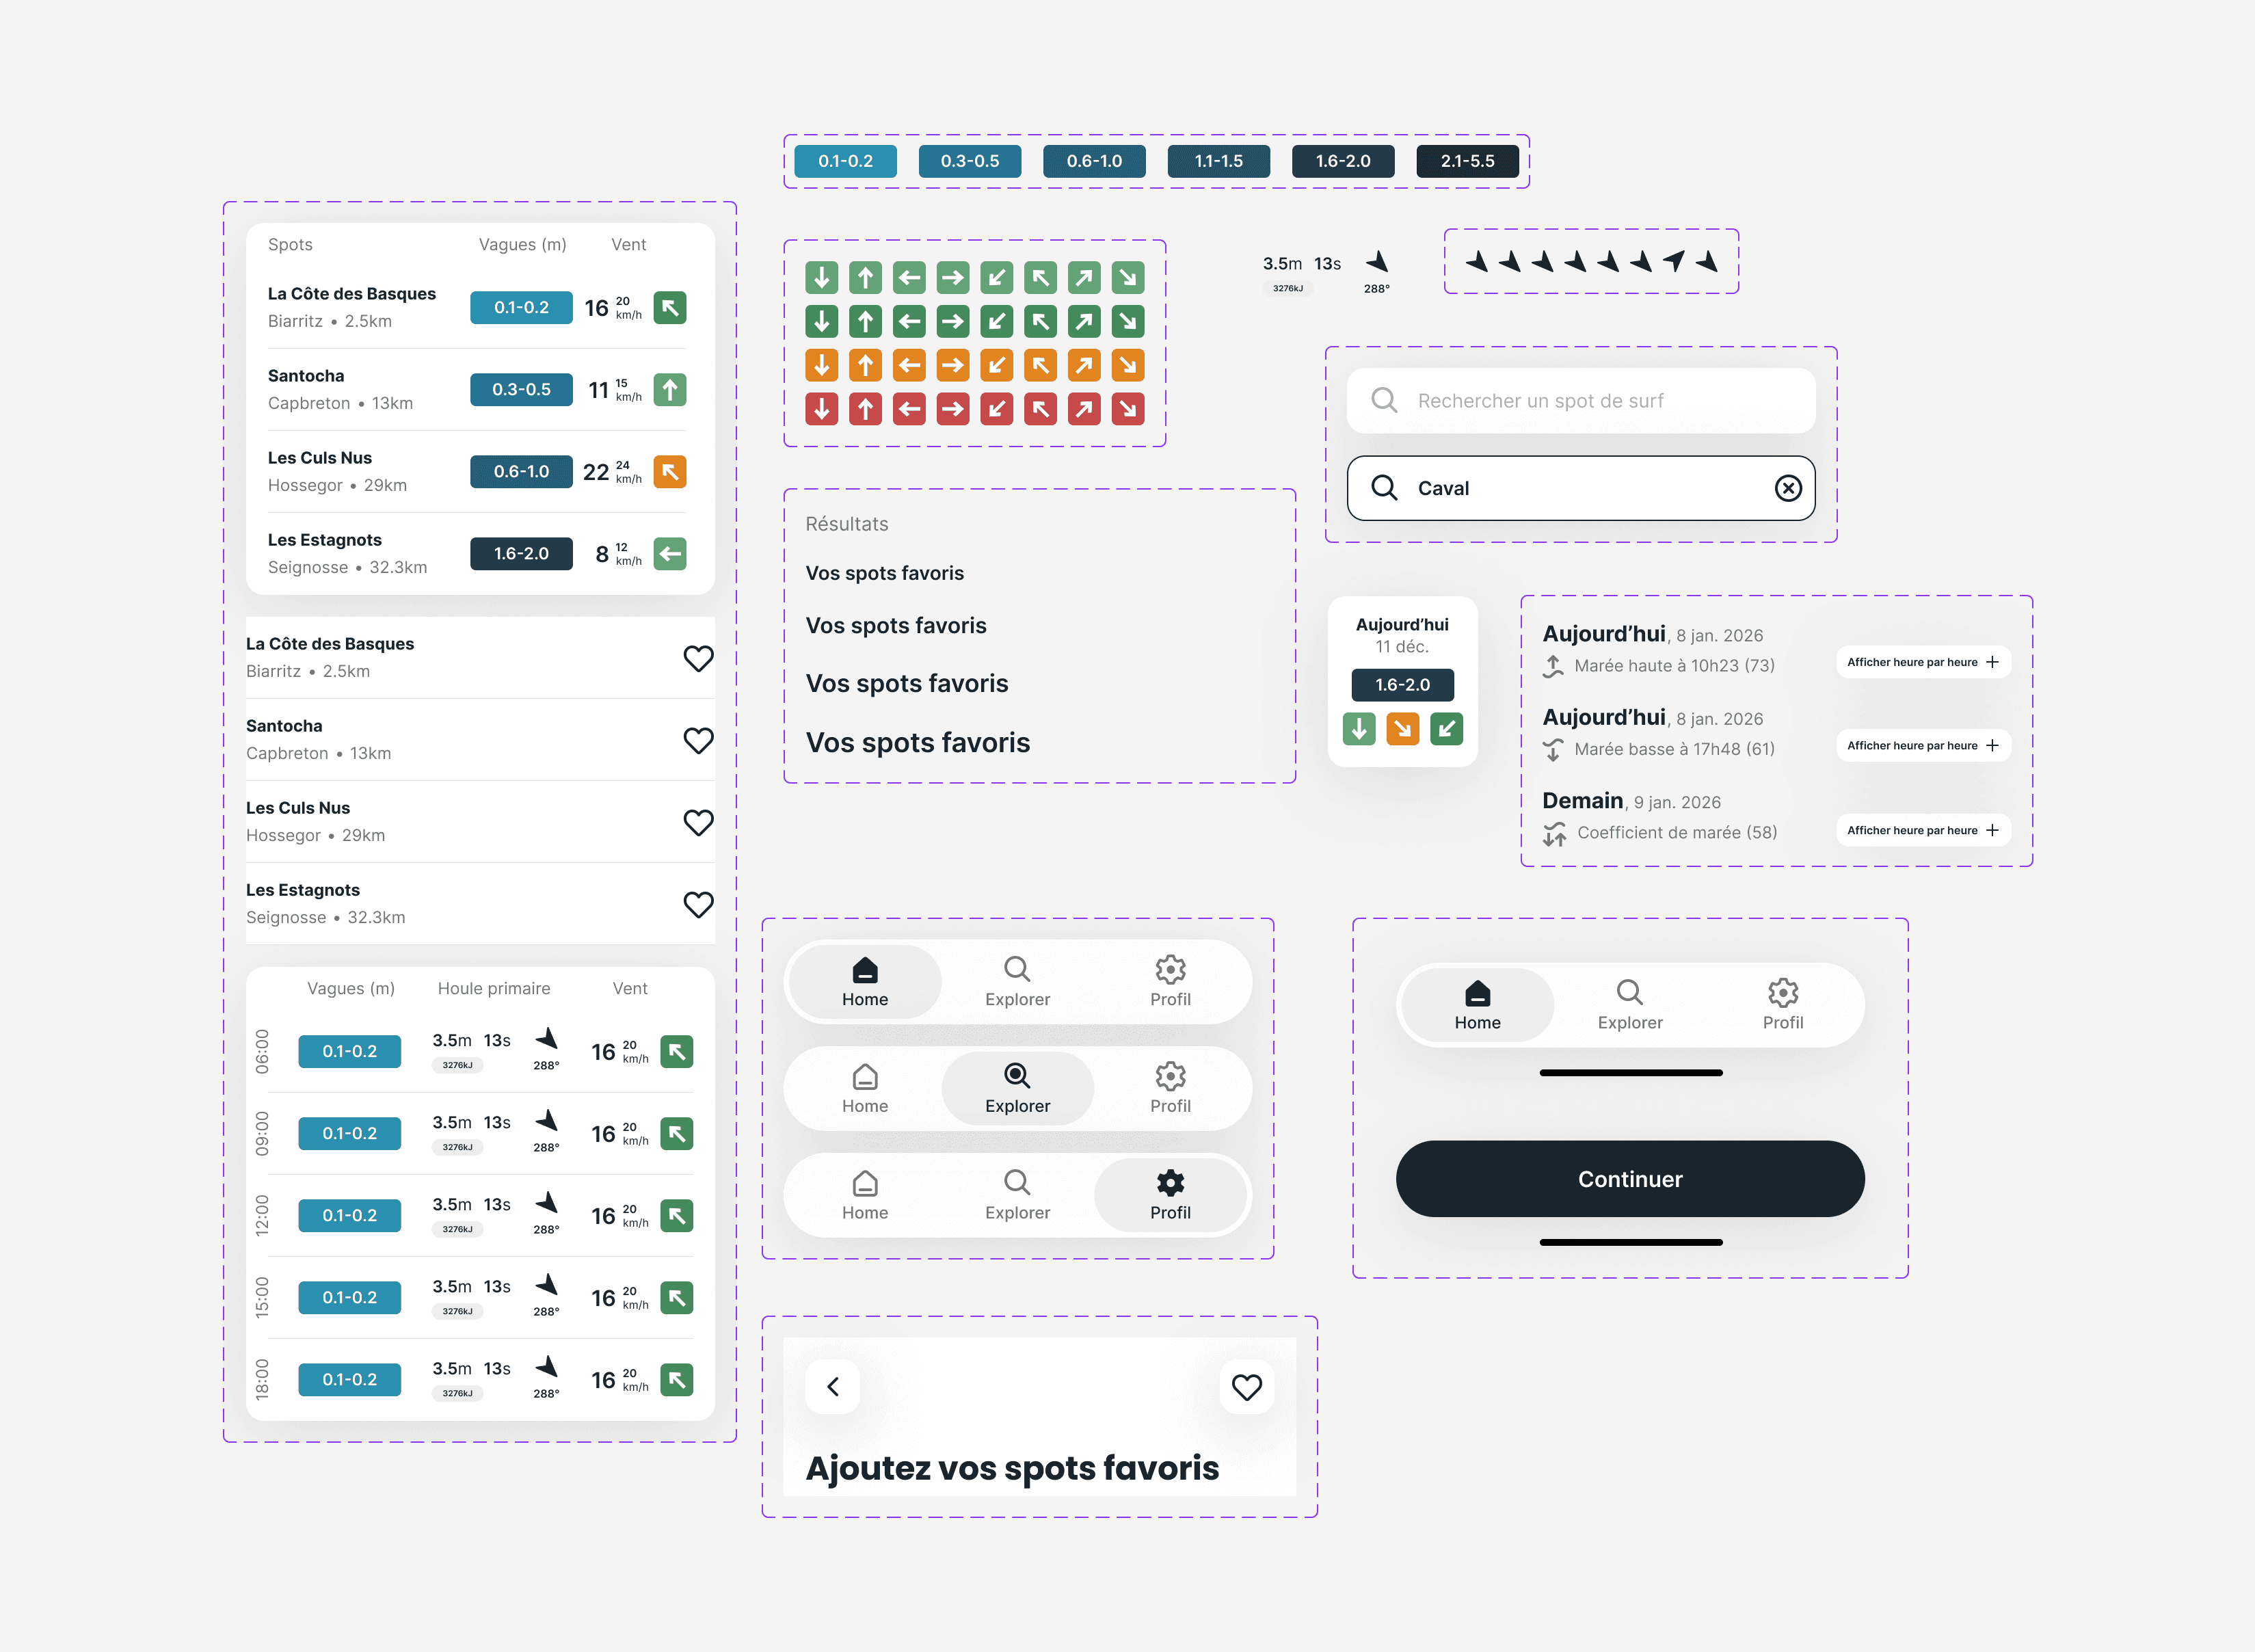
Color-coded wave height chips: a single teal-to-red scale that lets users assess conditions at a glance without reading a single number in detail, consistent across the home feed, spot detail, and hourly view
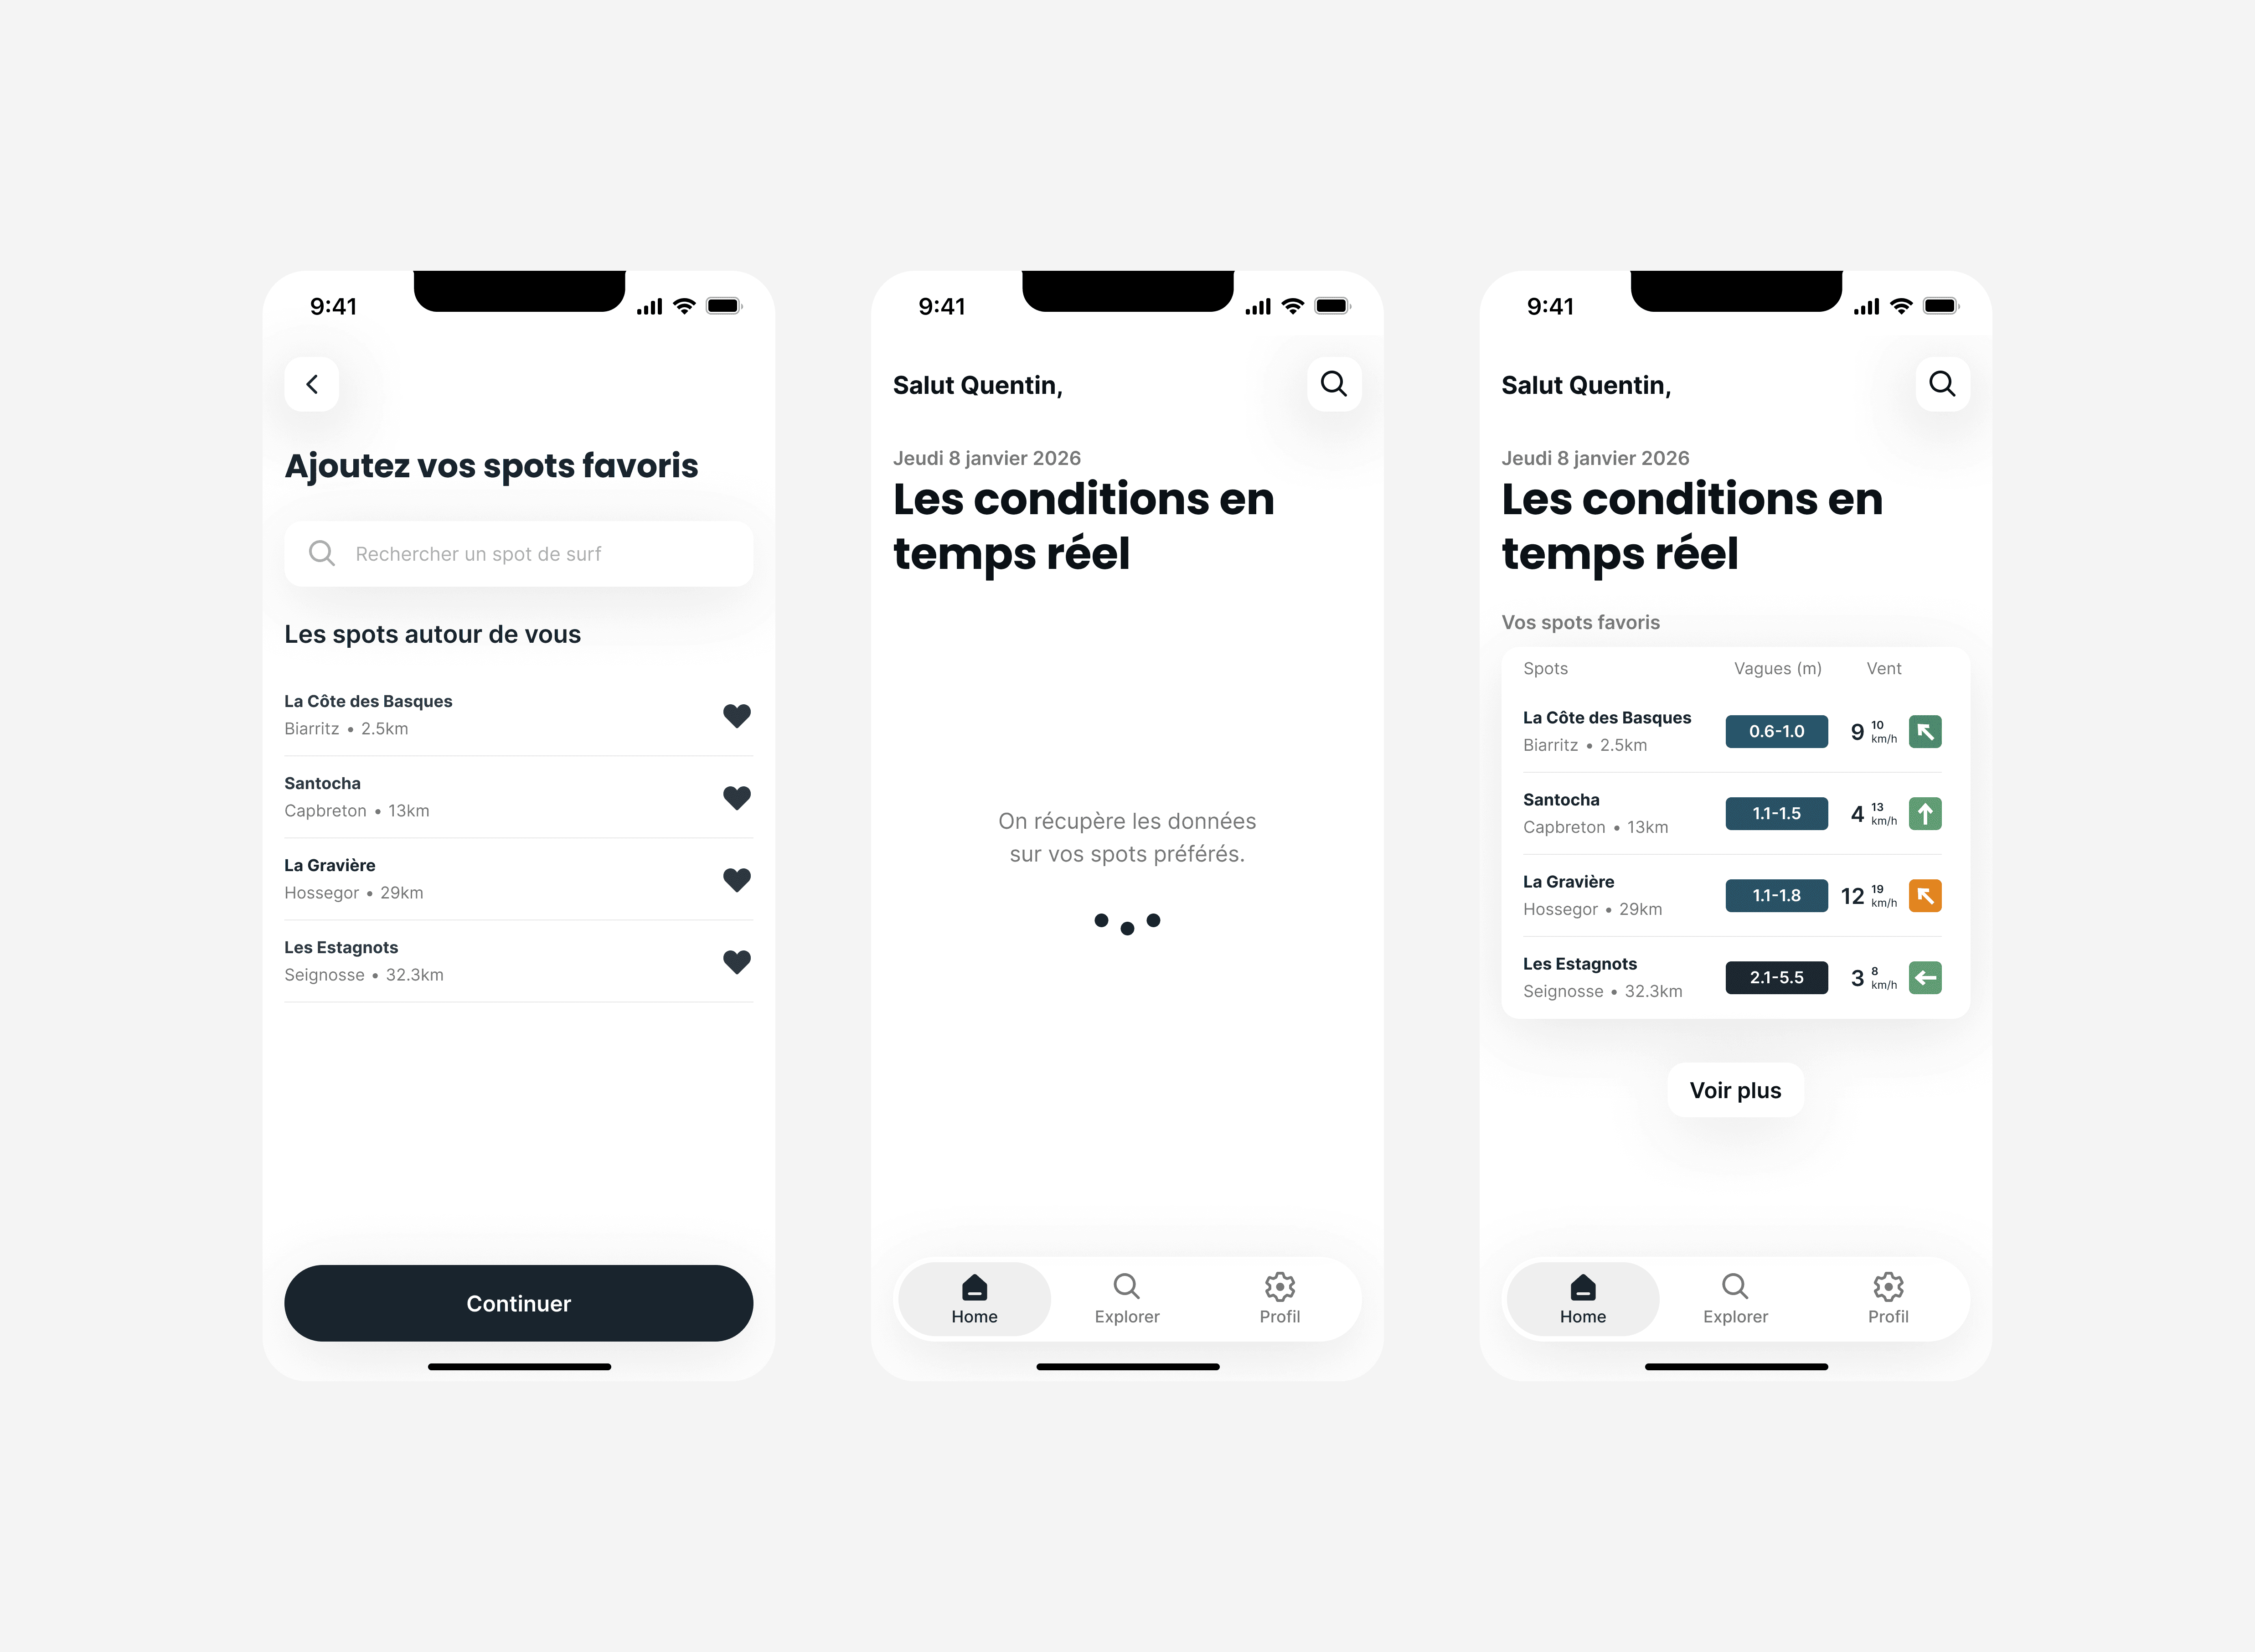
Favorite spots dashboard as the home screen: the first thing users see is their personal shortlist with wave height, wind speed, and wind direction, eliminating the need to navigate before getting to useful information
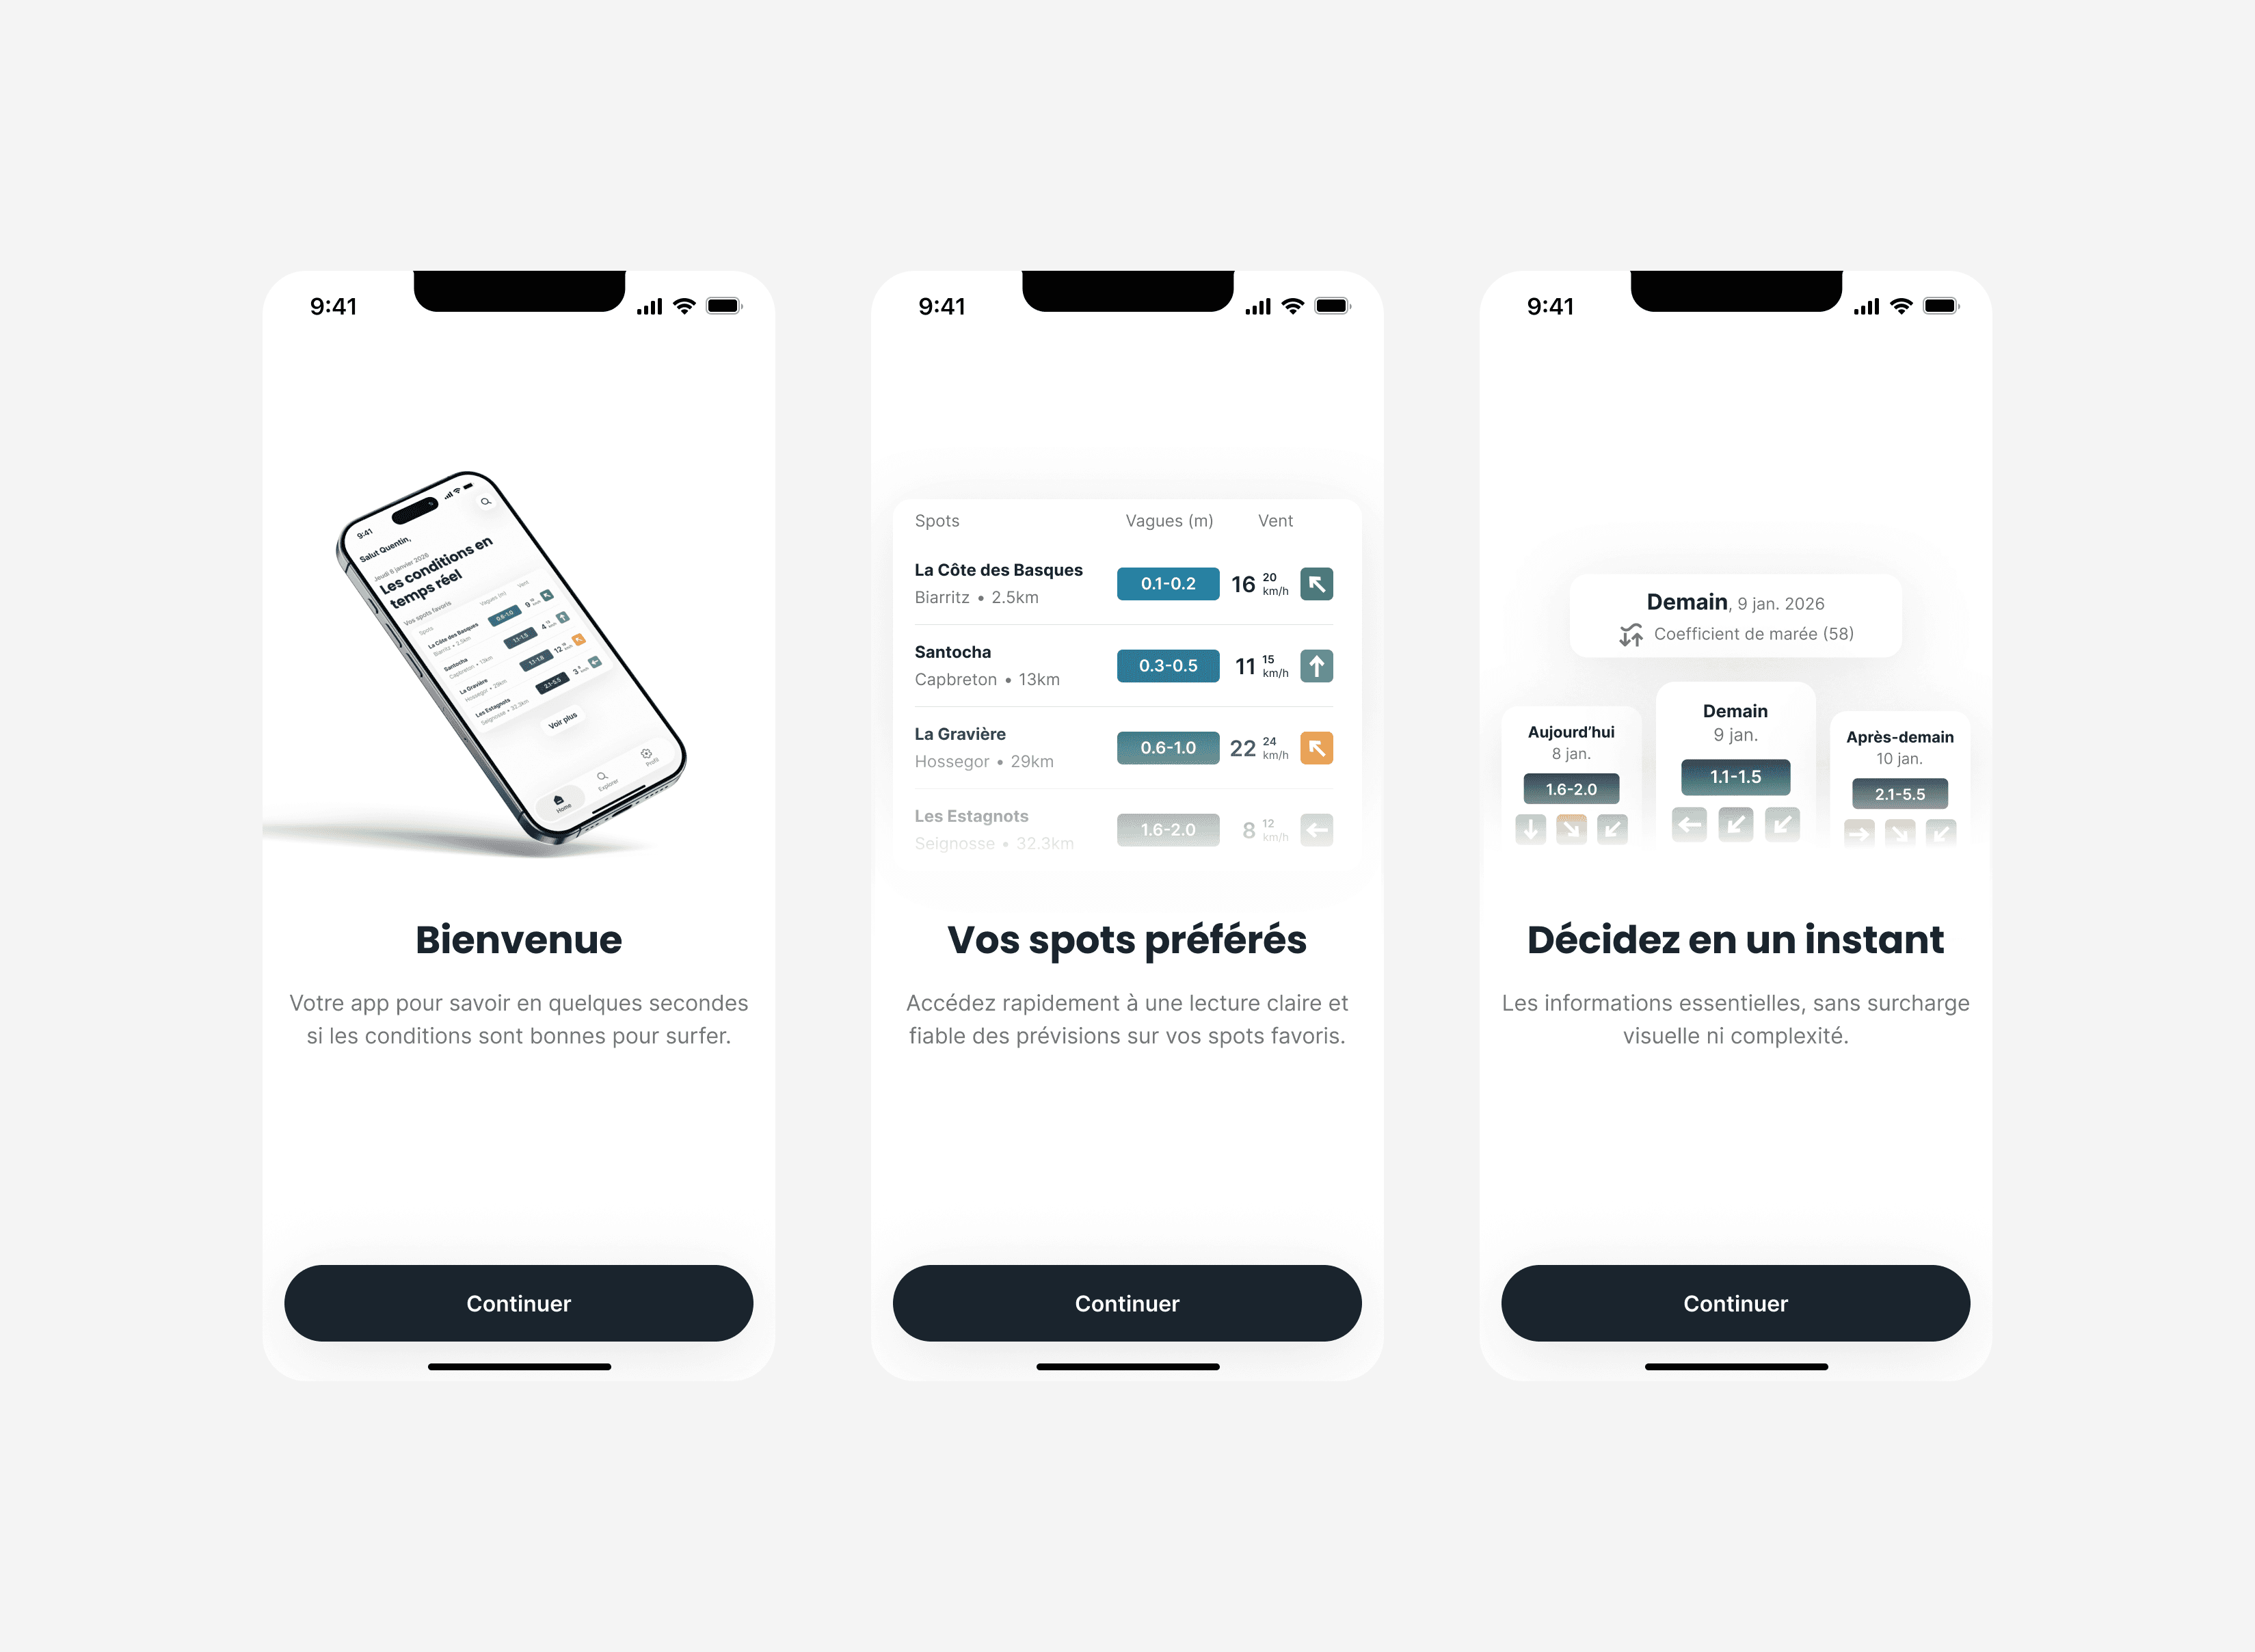
Streamlined onboarding: a 3-step flow captures favorite spots on first launch, ensuring value delivery before the user reaches the home screen for the first time
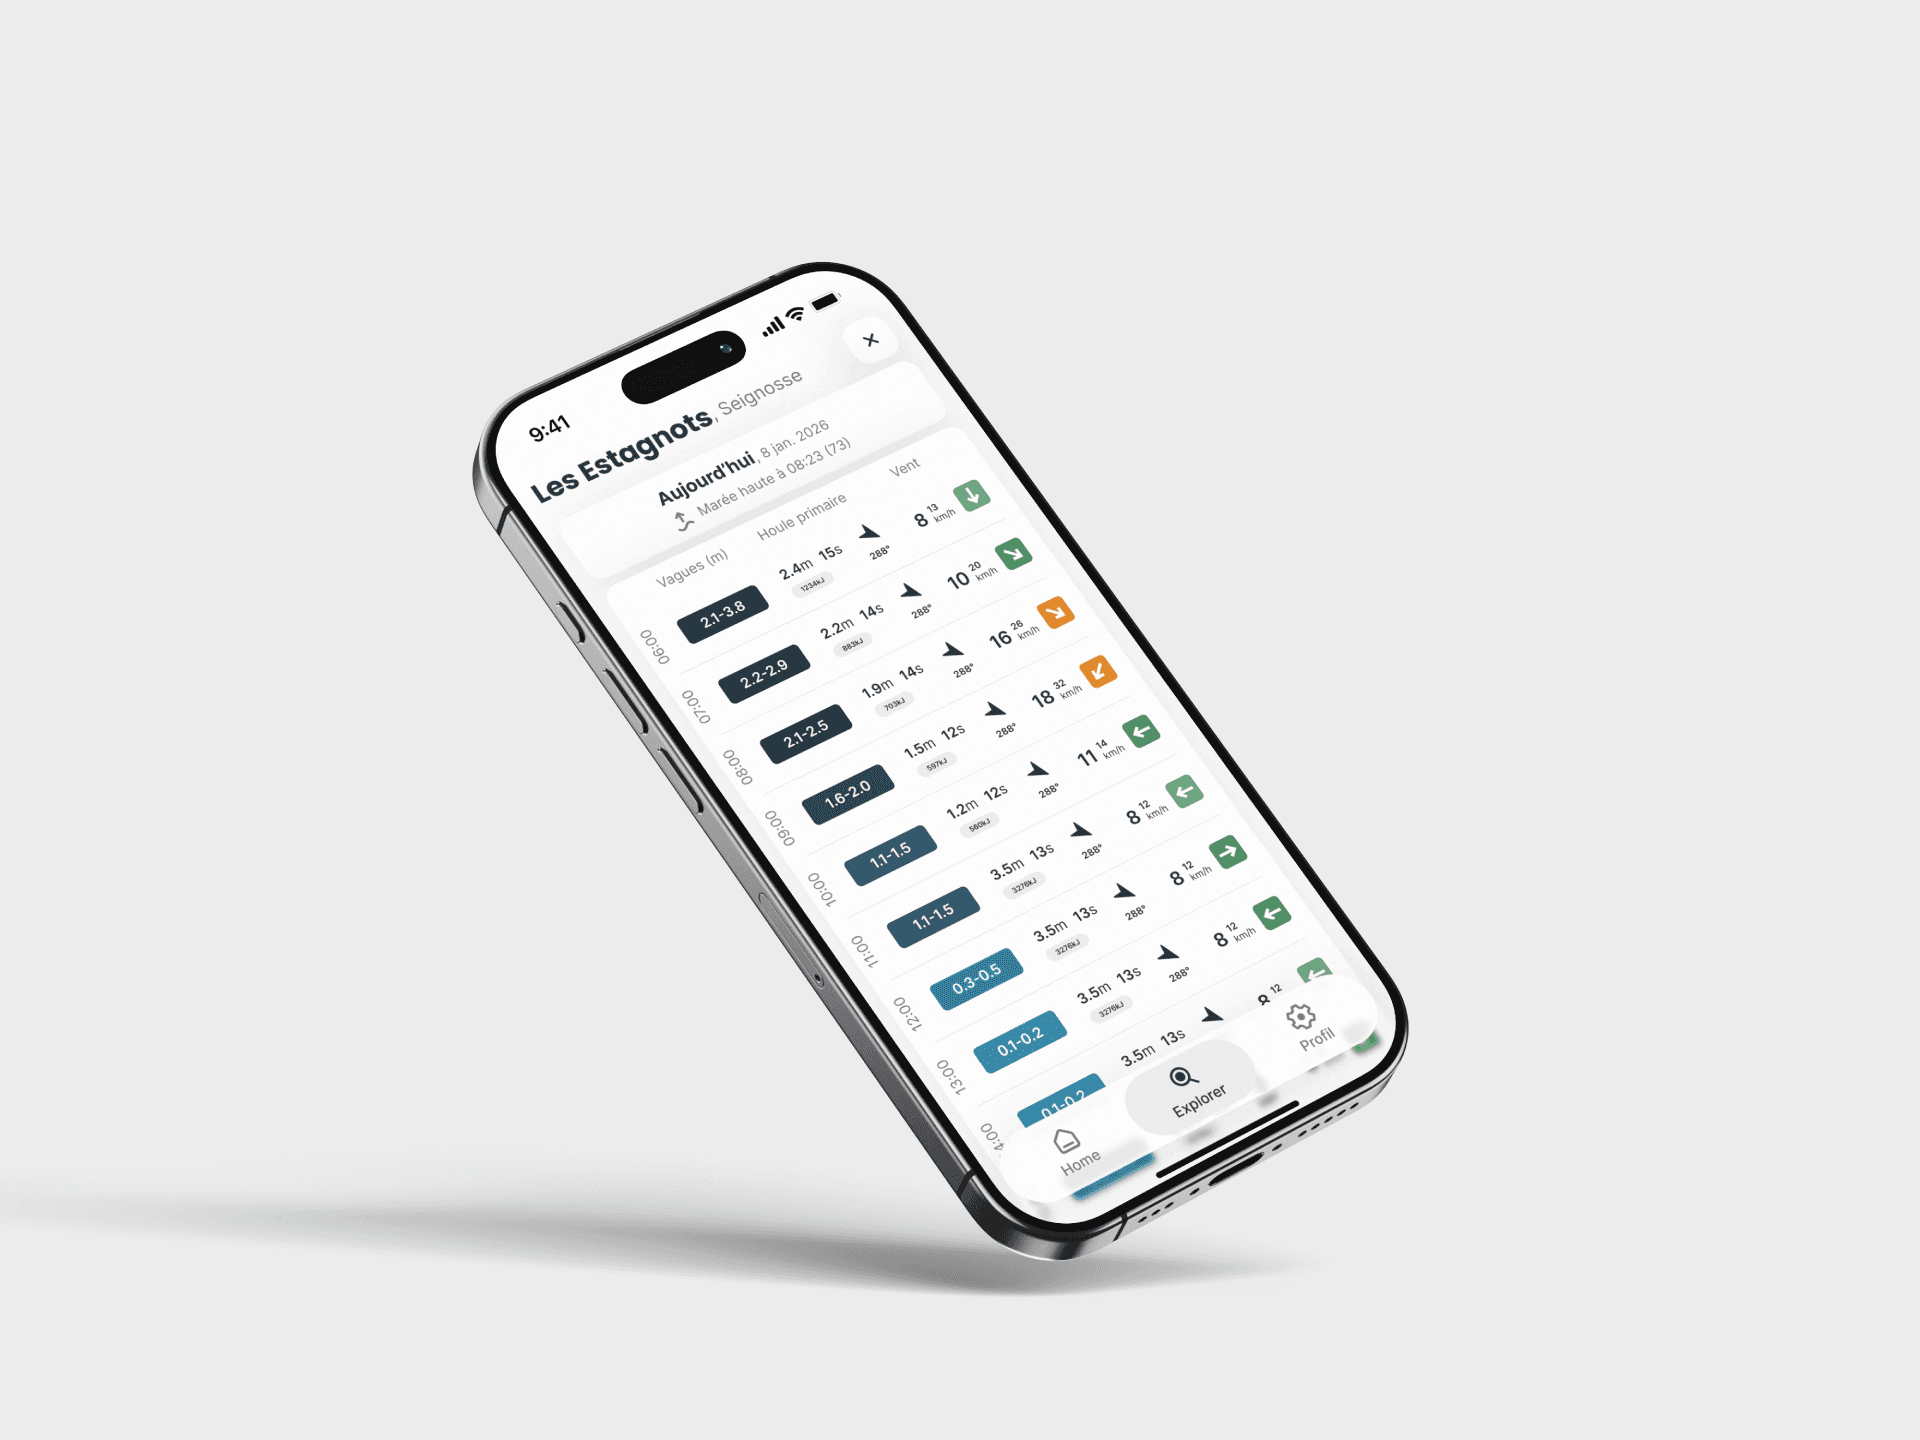
Hourly spot detail view: for users who want to go deeper, a time-scrolling table surfaces swell height, primary swell period, direction, and wind in a clean grid, replacing the raw data overload of competitors
Atomic design system: modular components (Forecast Cards, Spot Headers, Data Rows, Wave Chips) ensure consistency while accelerating the design-to-dev handoff